🍉CSDN小墨&晓末:https://blog.csdn.net/jd1813346972
个人介绍: 研一|统计学|干货分享
擅长Python、Matlab、R等主流编程软件
累计十余项国家级比赛奖项,参与研究经费10w、40w级横向
文章目录
- 1 求矩估计
- 2 求似然估计量
- 3 求置信区间
- 4 EM 算法
- 5 实战:随机模拟方法给出置信区间
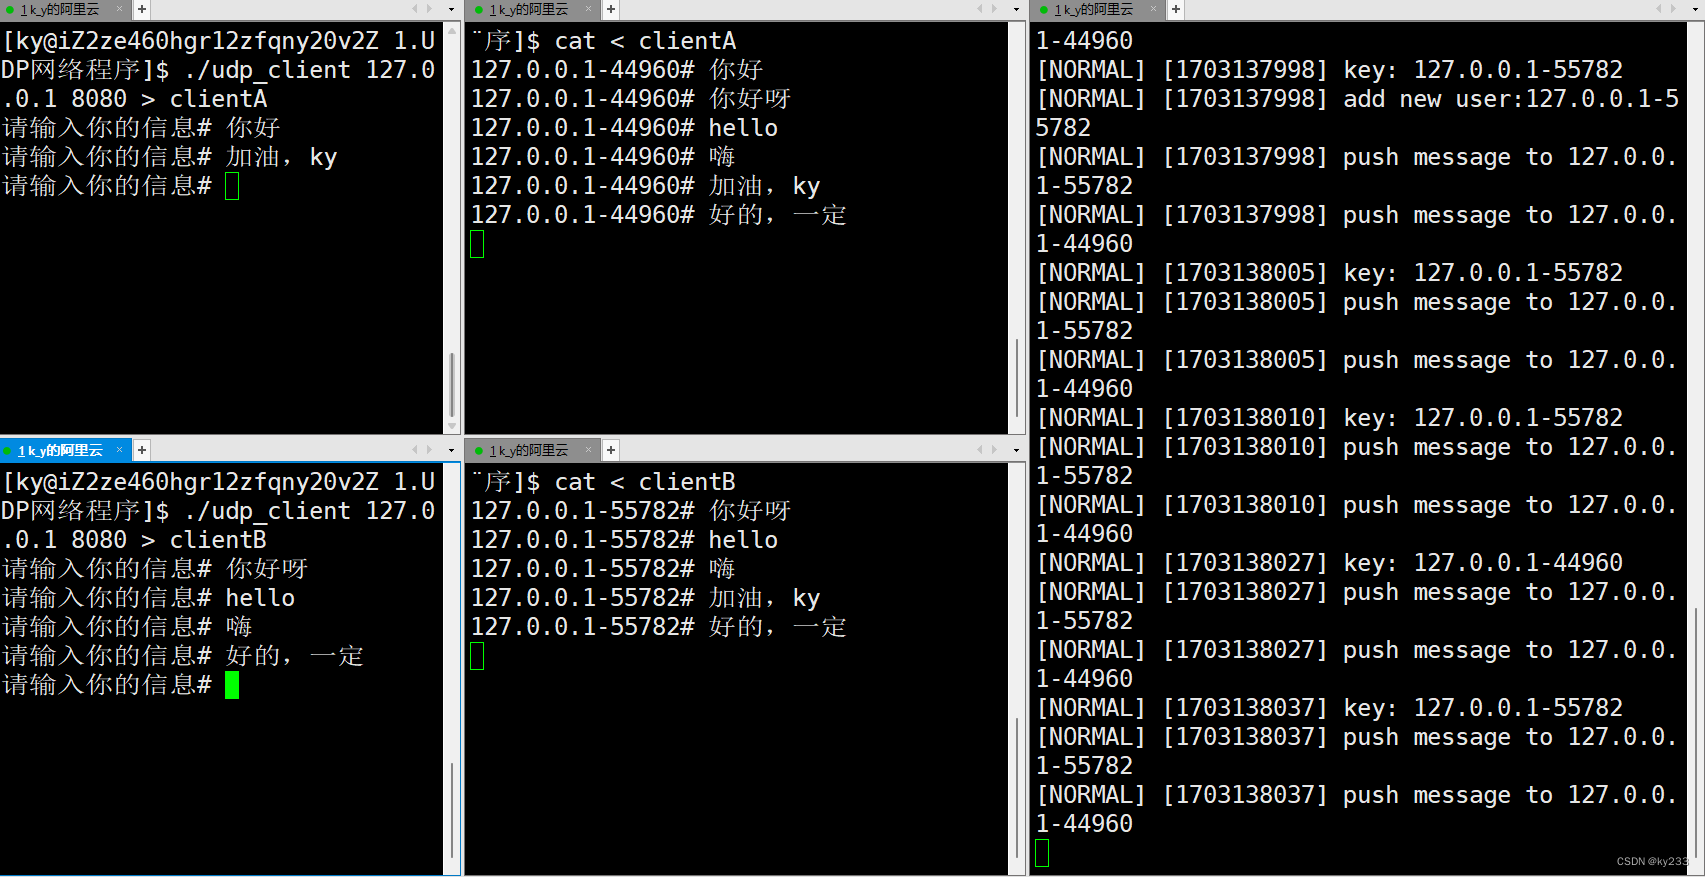
该篇文章以实例的形式演示了利用R语言实现了参数估计方法:矩估计;似然估计量;置信区间,同时利用火山灰数据进行随机模拟方法给出置信区间。
1 求矩估计
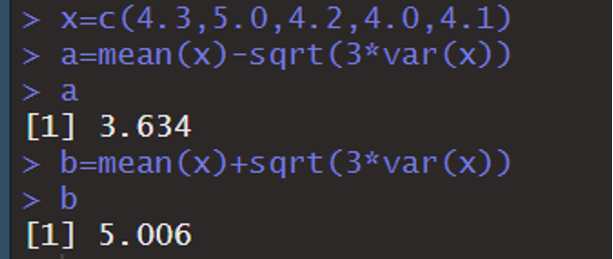
样本x来自均匀分布U(a,b)。
运行程序:
x=c(4.3,5.0,4.2,4.0,4.1)
a=mean(x)-sqrt(3*var(x))
a
b=mean(x)+sqrt(3*var(x))
b
运行结果:
2 求似然估计量
设似然函数为: L ( p ) = p 20 ( 1 − p ) 5 L(p)=p^{20}(1-p)^5 L(p)=p20(1−p)5。
运行程序:
f=function(p)
  (p^20)*(1-p)^5
optimize(f,c(0,1),maximum = TRUE)      #求最大似然
运行结果:

3 求置信区间
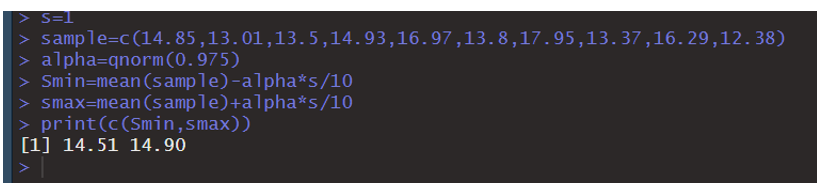
求置信区间(假设样本来自N(15,1),求均值的置信水平为95%的置信区间)。
运行程序:
a=15
s=1                        #方差为1
sample=c(14.85,13.01,13.5,14.93,16.97,13.8,17.95,13.37,16.29,12.38)
alpha=qnorm(0.975)
Smin=mean(sample)-alpha*s/10
smax=mean(sample)+alpha*s/10
print(c(Smin,smax))          #置信区间
运行结果:
4 EM 算法
设一次试验可能有四个结果,其发生的概率分别为 1 2 − θ 4 \frac{1}{2}-\frac{\theta}{4} 21−4θ, 1 − θ 4 \frac{1-\theta}{4} 41−θ, 1 + θ 4 \frac{1+\theta}{4} 41+θ, θ 4 \frac{\theta}{4} 4θ,其中 θ \theta θ属于(0,1),现进行197次试验,四种结果的发生次数分别为75,18,70,34.试求 θ \theta θ的MLE。
运行程序:
s=c(75,18,70,34)
f=function(theta)((2-theta)^s[1])*((1-theta)^s[2])*((1+theta)^s[3])*((theta)^s[4])
optimize(f,c(0,1),maximum=TRUE)
运行结果:

最大似然:0.6067。
5 实战:随机模拟方法给出置信区间
运行程序:
attach(faithful)                                      #获取火山灰数据
population <- sample(eruptions,1000,replace = T)      #做1000次有放回取样
N <- length(population)                               #总体数量
mu<- mean(population)                                 #总体均值
sigma <- sd(population)*sqrt((N-1)/N)                 #总体标准差(注:样本方差除以(n-1))
layout(matrix(1:1, 1, 1))                             #图像输出位置
experimentes=100
n <- 30
sample_sd <- sigma/sqrt(n)                            #
z<-qnorm(0.975)            #计算置信水平为95%的z值
z

plot(mu,experimentes,type="n",xlim=c(mu-6*sample_sd,mu+6*sample_sd),
     ylim=c(0,experimentes))
abline(v=mu) #x=mu的垂直竖线作为参考线
for(i in 1:experimentes){
  mean_of_x <- mean(sample(population, n))
  co.inter <- c(mean_of_x - z*sample_sd, mean_of_x + z*sample_sd)
  if(co.inter[1] < mu & mu <= co.inter[2]) lines(co.inter, c(i, i), type="l")

  else lines(co.inter, c(i, i), type="l", col=2)
}
返回结果:置信水平为95%的z值
Z:1.96。
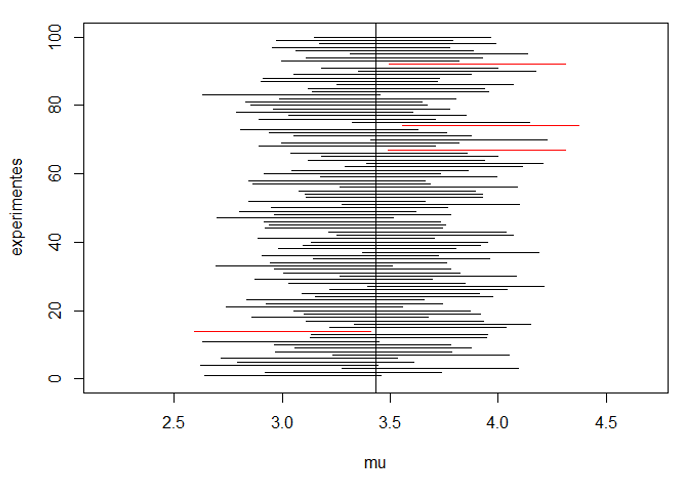
置信水平为0.95的置信区间的含义是未知参数有95%的概率落在此区间中,黑色线表示在该置信水平下落入置信域,红色线表示在该置信水平下未落入置信域。